I'm back in the field tomorrow heading north to Charters Towers and onto Wambiana Station, a cattle property where a trial started in 1997 to test and develop sustainable and profitable strategies to manage for rainfall variability in extensive grazing lands.


Five replicated grazing strategies (moderate stocking, heavy stocking, rotational wet-season spelling, and two variable stocking strategies) have been applied across the 10 paddocks, each 100Ha in size, since 1997. From the phase 1 report, the trial showed how loss of land condition under heavy stocking compromised productivity, profitability and the local environment whereas moderate stocking led to sustained productivity and improved profitability.


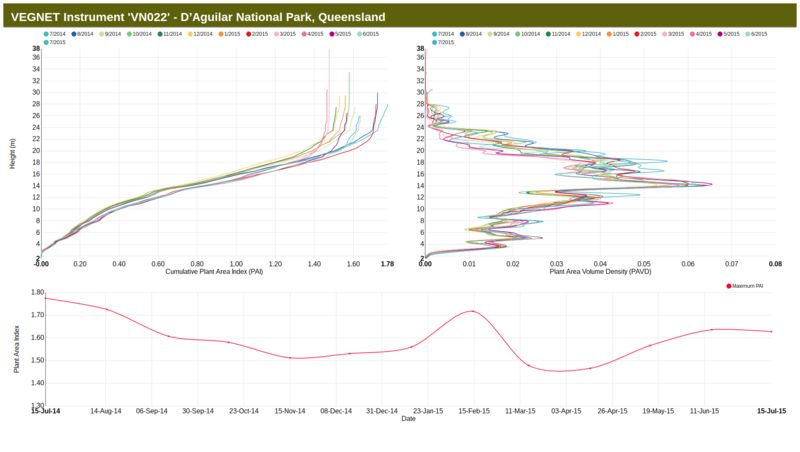
The trial has continued, providing superb long term data to support Earth Observation based analysis. My initial work developing algorithms to reliably recover fractional cover from Landsat led to us building tools such as VegMachine and the APIs and imagery that power the NRM Spatial Hub. These tools look at ground cover, and its trend over time, and in comparison with reference areas, provide synoptic information to land managers.


But cover within a pixel is only part of the story. Processes such as soil movement, wind erosion and water infiltration are also sensitive to the way the cover is arranged, the size of the clumps of vegetation and the space between them and this clumping has been shown to be sensitive to grazing pressure.


This field trip will collect stacks of data using the national protocol, but with additional transects at a 0.2 meter spacing. This will allow us to start looking at the spatial variance at a high spatial resolution, and then scale to see how that would look given various satellite sensors. We'll be getting Worldview-3 imagery, Planet Labs imagery, Sentinel-2 and Landsat imagery across the site over the coming weeks.


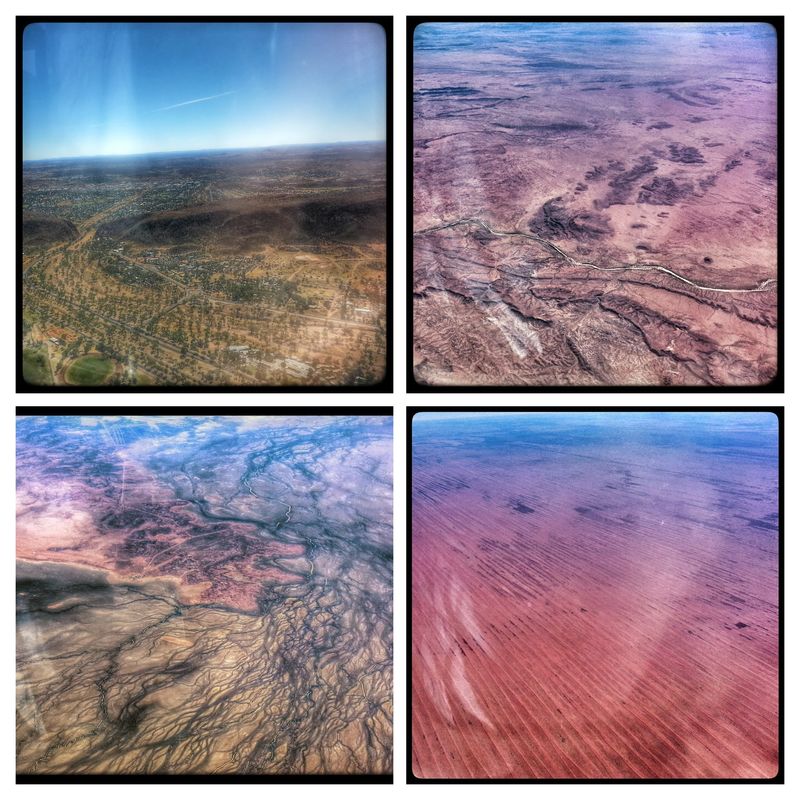
The image above is the Wambiana paddocks and land types overlaid on a Planet Labs image acquired just 2 weeks ago. I'm super lucky to be part of their Planet Explorers program so I get to access and work with this fresh imagery. I decided (the day before heading out there) that I should look at the variograms of some of the paddocks using this imagery.


Variograms are kind of nice for investigating the spatial continuity of data and have three cool diagnostic features, the distance where the model flattens out (the range), the height where this happens (the sill) and the height where the line crosses the y axis (the nugget). Sample locations separated by distances closer than the range are spatially autocorrelated. The height of the sill is a measure of the overall variance of the samples, and the height of the nugget indicates spatial sources of variation at distances smaller than the sampling interval. I did part of my PhD on scale many years ago, so it's nice to be putting it to use again.

What we see at Wambiana , using just the red band from the Plant Labs 3.2 m imagery, QGIS and a few lines of Python, is pretty interesting. There's significant subpixel variance in the high and moderate stocking paddocks,. The high stocking rate paddock has a significantly higher sill, or overall variance, and the range to reach this is greater than the other strategies indicating quite a clumped landscape. And the variable and moderate stocking rate paddocks have similar overall variance but quite different spatial structure in the 0 to 10m scale. So even though it's tricky to see any difference at all in the strategies from the imagery directly, the spatial statistics are showing clear differences in the landscape's response to grazing management.


Once we get into the field and start observing the landscape at a field scale, we can start connecting these spatial statistical measures to landscape processes and then start building the science and tools around them to ultimately help land managers. My suspicion is that Landsat will lack the spatial resolution required to monitor spatial changes in landscapes while Sentinel 2 may show some useful detail. But I think application may suit Planet Labs imagery pretty well - because we're looking at spatial variation, the absolute spectral and radiometric calibration are not as critical as they are for spectral based algorithms, the imagery is now super regular and affordable and the delivery over APIs lends itself to automation of monitoring tools for end users.


So stay tuned as we capture a stack of data and post updates from the field over the next few weeks...

Data for this provided by:
Planet Team (2017). Planet Application Program Interface: In Space for Life on Earth. San Francisco, CA. https://api.planet.com


A couple of days ago the team moved the Vegnet In-Situ Monitoring LiDAR (IML) to the Spyglass Beef research station out of Charters Towers. We've been running this instrument for a couple of years in Brisbane Forest Park (BFP) to monitor the dynamics of plant area Index, structure and phenology of the eucalypt canopy up there.


At BFP, after a year or so we captured enough data to build plots like these which show the changes in plant area and vegetation density over time in response to climate and seasonal conditions.
By moving it to Spyglass, a world class research facility and part of the GEOGLAM-RAPP network we hope to better understand the canopy dynamics in this highly variable and productive savanna grazing system.


The system works by blasting the trees with laser beams every night and recording the number of hits. The system is self contained and solar powered so it only needs downloading every couple of months.


At the same time, we installed two time lapse cameras. These look in and out of the exclosure where the vegnet is located and take photos every 10 minutes. We'll use these to look at the grassland response to rainfall, the change in grass height over time, and the mechanisms of senescence and detachment to better parameterize models of grassland behaviour.


For more details on Vegnet, have a look at the following paper:
Portillo-Quintero, C.; Sanchez-Azofeifa, A.; Culvenor, D. Using VEGNET In-Situ Monitoring LiDAR (IML) to Capture Dynamics of Plant Area Index, Structure and Phenology in Aspen Parkland Forests in Alberta, Canada. Forests 2014, 5, 1053-1068.


This was a combined DSITI, The University of Queensland JRSRP, the University of NSW and Tern-Auscover revisit to the Injune Landscape Collaborative Project (ILCP) site that coincided with airborne capture of dual wavelength full waveform lidar, hyperspectral imagery and thermal imagery over the site by Airborne Research Australia (ARA), a program within the University of Adelaide. The field work had two main objectives:
  1. To calibrate and support the airborne imagery capture with a standard set of spectral, atmospheric and field measured biophysical parameters; and
  2. To remeasure several field plots first sampled in 2000 as part of a joint NASA/CSIRO/QNRM mission and were been subsequently measured in 2009 as part of our collaboration with the Japanese Aerospace Exploration Agency (JAXA) ALOS Kyoto and Carbon Initiative.
Over the week we travelled several hundred kilometers setting up calibration plots and field sites to cover a range of forest and woodland types.


The ILCP is recognised internationally as a key site (and one of only a few located in woodlands and open forests) that has facilitated the development of new algorithms for retrieving biophysical attributes and detecting change with long term remote sensing observations at multiple scales. These data will contribute to DSITI's fractional cover and wooded extent mapping programs, and will build on the existing data to better understand ecosystem response to change and allow the calibration and validation of new spaceborne sensors.

Day 1

We'd arrived in the night, after travelling via Morven to pick up a GPS base station from ARA who were preparing to capture Lidar and Hyperspectral data over the site. We set this up on a station in the middle of the site on Mt Owen Station and let it log for the week to act as a control point to geometrically correct the data.

We camped in the forestry hut on site. Dawn on the first day was about 1 degree so the first job was to chop some wood and get the fire going. After checking and packing the gear one group set off to start measuring a forest plot and a second group went to set up the hyperspectral calibration targets.


We set these three targets up at the end of the Mt Owen airstrip on day 1 and set about measuring their reflectance. There's a black, grey and white one. We also used a sun photometer to measure water vapour, areosol optical depth and ozone throughout the campain, fixed the position of the targets using DGPS and measured the temperature of the targets to help calibrate the thermal data sets.


Meanwhile, the second group was scanning the woodland site with the terrestrial laser scaner (TLS) and tagging and measuring the size and location of every tree. These trees had been measured in the past and so by remeasuring them we can start to see subtle changes in the site biomass, and link these measurements with the terrestrial laser scanner and airborne data.


We also ran a new experiment at this site, sampling our traditional star transects at a 50cm rather than 100cm interval. This is part of a scaling experiment designed to better sample the spatial variability of land cover classes and how they respond to changing climate, fire and grazing impacts. In this photo you can see the clumped nature of the bare and grassy tussock patches (and the cool sampling pole mount for the ODK enabled mobile phone to record data). As we better understand the clumping of the ground and canopy cover elements across landscape, canopy and leaf scales, we can better model how they respond to disturbance and change and better link remote sensing data captured across these multiple scales.

It also helps refine our ground cover model, which allows us to predict the amount of ground cover under the tree canopy.

This is a screen grab from my android mapping app over a portion of the site. My tracklog is in blue and the imagery is the standard Google earth image. It's a mixed open pasture and woodland environment with a long land management history.


This is the same region with the most recent Landsat fractional cover displayed. The tree covered areas (and riparian corridors) are green (high green cover) and there are some blue paddocks (dry non-green grasses) and red (bare) patches and roads. But from this we don't really know the grassland condition under the trees, or even in the mixed tree-grass paddocks. But if we model the tree cover and understand the scaling we can estimate the cover under the trees quite accurately.


The cover under trees (ground cover) image paints quite a different picture of the cover composition on the ground (it's using the same colour scale as the fractional cover image) - there is very little green ground cover but the forested areas still have high non-green cover due to the large amount of litter. You can also see that the river corridor is very bare in this area due to access by grazing animals, and that small patches of green forage still exist in places under the canopy, where they managed to miss the severe frosts that occurred over the site a month ago. This ground cover product is pretty useful for grazing land management and erosion modelling which is why we're spending some time improving and validating it.


Day 2


Day 2 started with some broken cabling which required some field repairs but we soon had the calibration site set up on a different station and the overflights by the hyperspectral and lidar instruments underway.


This "small world" panorama of the calibration site shows the black, white and grey targets set out under a beautiful cloudless day. We set the targets out on a clear, flat area and send the coordinates via satellite SMS to the plane who then capture imagery over them several times during the flight.


With the flights complete, I took off to help the others with the vegetation samples but got a flat a few kilometres down the road. Luckily I had the support of about 40 head of cattle to get me on my way.


Many of the tracks on this site are pretty rough and sandy making a 4WD essential to get around this remote area. It also meant long days travelling to and from the camp site to get the work done, and some time spent clearing debris from tracks to get through to the sites. But it's a beautiful landscape.


Day 3

Day 3 started with another spiked tyre en-route to the site. This used my last spare, so after replacing the tyre, we cleaned and plugged the hole, popped it back out onto the rim and re-inflated in case we needed to use it again. Luckily we didn't :)


This day we sampled a very dense sitewith heaps of stems in the 50m plot, so Richard made use of a log for a field chair while he took bearings and distances to all the measured trees to make a tree map.


Meanwhile the grassand litter biomass sampling team ran an impromptu training session in pasture harvesting so we could get more grassland biomass data to relate back to the terrestrial laser scanner (TLS) data.


These quadrats were sampled in precise locations across the site after the TLS scans so we can relate the grass height measured off the scans to the amount of biomass present on the site. this will be useful as we start to develop better grass biomass relationships based on optical and radar data in the future.


Day 4


And of course we took many TLS scans. On most of these field site we also set up several permanent marks (buried steel pegs in concrete collars) so we'll be able to precisely co-register any future scans to better measure very subtle changes across the site with a greater precision than ever before.


The scans will be used to link the field measurements to the airborne and satellite data sets, furthering our understanding of the ecological processes and changes in these dynamic woodland environments.


I'd like to thank everyone involved, it was a great week topped off by a hot shower and meal at the Courthouse in Mitchell (complete with Horse at the bar - thanks for the photo John!).


Despite the 438 new emails in my inbox when we regained mobile coverage, I'm really looking forward to seeing the airborne lidar and imagery (and coincident Landsat, Sentinel-1, ALOS-2, Terrasar-X and MODIS data) over the coming weeks.


This week I had the chance to visit the pretty amazing and important EucFACE experiment, "..the world's only Free Air CO2 Enrichment experiment in native forest". The experiment consists of six carbon fibre rings, three of which expose the 25m circular region with a C02 level 150ppm higher than the current 400ppm level. The other three rings act as controls.
You can read more about the experiment at the UWS web site. We were visiting on behalf of TERN, performing follow up terrestrial laser scanner acquisitions at the six rings. These were initially visited three years ago, and researchers will use the data to look at changes across the site, particularly in the upper canopy. All of the collected scans, as with all TERN data, is accessible to researchers and the public through their portals and servers. For example, if you want to check the scans and photos for the first ring, all the data is sitting on the ftp site here.

As I tweeted last week, a really nice 100% javascript viewer for this data is plas.io and if you download one of the .laz format scans you can easily visualise in 3D and fly through the site using just the chrome web browser. The image below is a browser screengrab after loading this file. Have fun, and see if you can work out the identity of the researchers standing next to the scanner ;)


Today I helped organise a hands-on workshop and field visit covering some of the spatial mapping and monitoring tools available to rangeland managers in the context of farm planning, development and management. Held the day before the start of the 18th Biennial Conference of the Australian Rangeland Society in Alice Springs, it was supported by: TERN/AusCover (who paid for the Bus hire and Lunch), NT Department of Land Resource Management, NRM Spatial Information Hub, ACRIS and Queensland Department of Science, Information Technology and Innovation.

We were oversubscribed so the 25 seater bus was supplemented by five 4WDs to cater for the 35+ people attending. The Australian rangelands are pretty complex systems, driven by episodic rainfall, animals and fire and modified by changing species composition (particularly Buffel grass) and this was all to apparent on the flight across, where I photographed all these systems out the window once the cloud cleared around Chinchilla:


We started with an indoors hands-on session at the Arid Zone Research Institute covering the synergies, strengths and monitoring requirements in each of the participating organisations. We also looked at how the various products and tools work, how they can be accessed and used both digitally and as paper maps, and how downloadable reports can be generated from online systems operating remotely.


We then traveld to Old Man Plains Research Station to demonstrate the mapping and monitoring tools in the context of property planning, development and management. Over three stops we looked at:
  • Field data collection and groundcover interpretation
  • Linking monitoring sites and historical photos and climate information to satellite image products of fire, water and cover, and how that information can be used to help understanding and assessment of the pasture resource; and
  • The effect of woody vegetation state, change and response to fire on monitoring programs, and how some of our current national woody products work in the acacia + bright soil rangeland environments.

We had plenty of time to run through where these products work, and more importantly don't work, what their limitations are, and got some great feedback on improvements we could make in terms of delivery and extension. Thanks to a fantastic range of participants from across the country who were ready to engage, we all learnt a lot from each other. If you want to see where we went or some of the data we were playing with grab the Google Earth kmz from the day. I'm now looking forward to helping with a cut down version of this trip tomorrow as part of the "Technology and diversification in pastoralism - living off the rangelands" field trip tomorrow. Stay tuned.

.